About This Project
Self-driving cars are now a daily reality on American streets. Waymo, the largest robotaxi service in the United States, carries public riders in fifteen metro areas as of October 2026 — from Phoenix, where it began in 2020, to Las Vegas, added in September 2026 — and has announced more.
But how safe are these cars, really? This project gathers every publicly reported crash involving a Waymo vehicle and presents the data in a way anyone can understand.
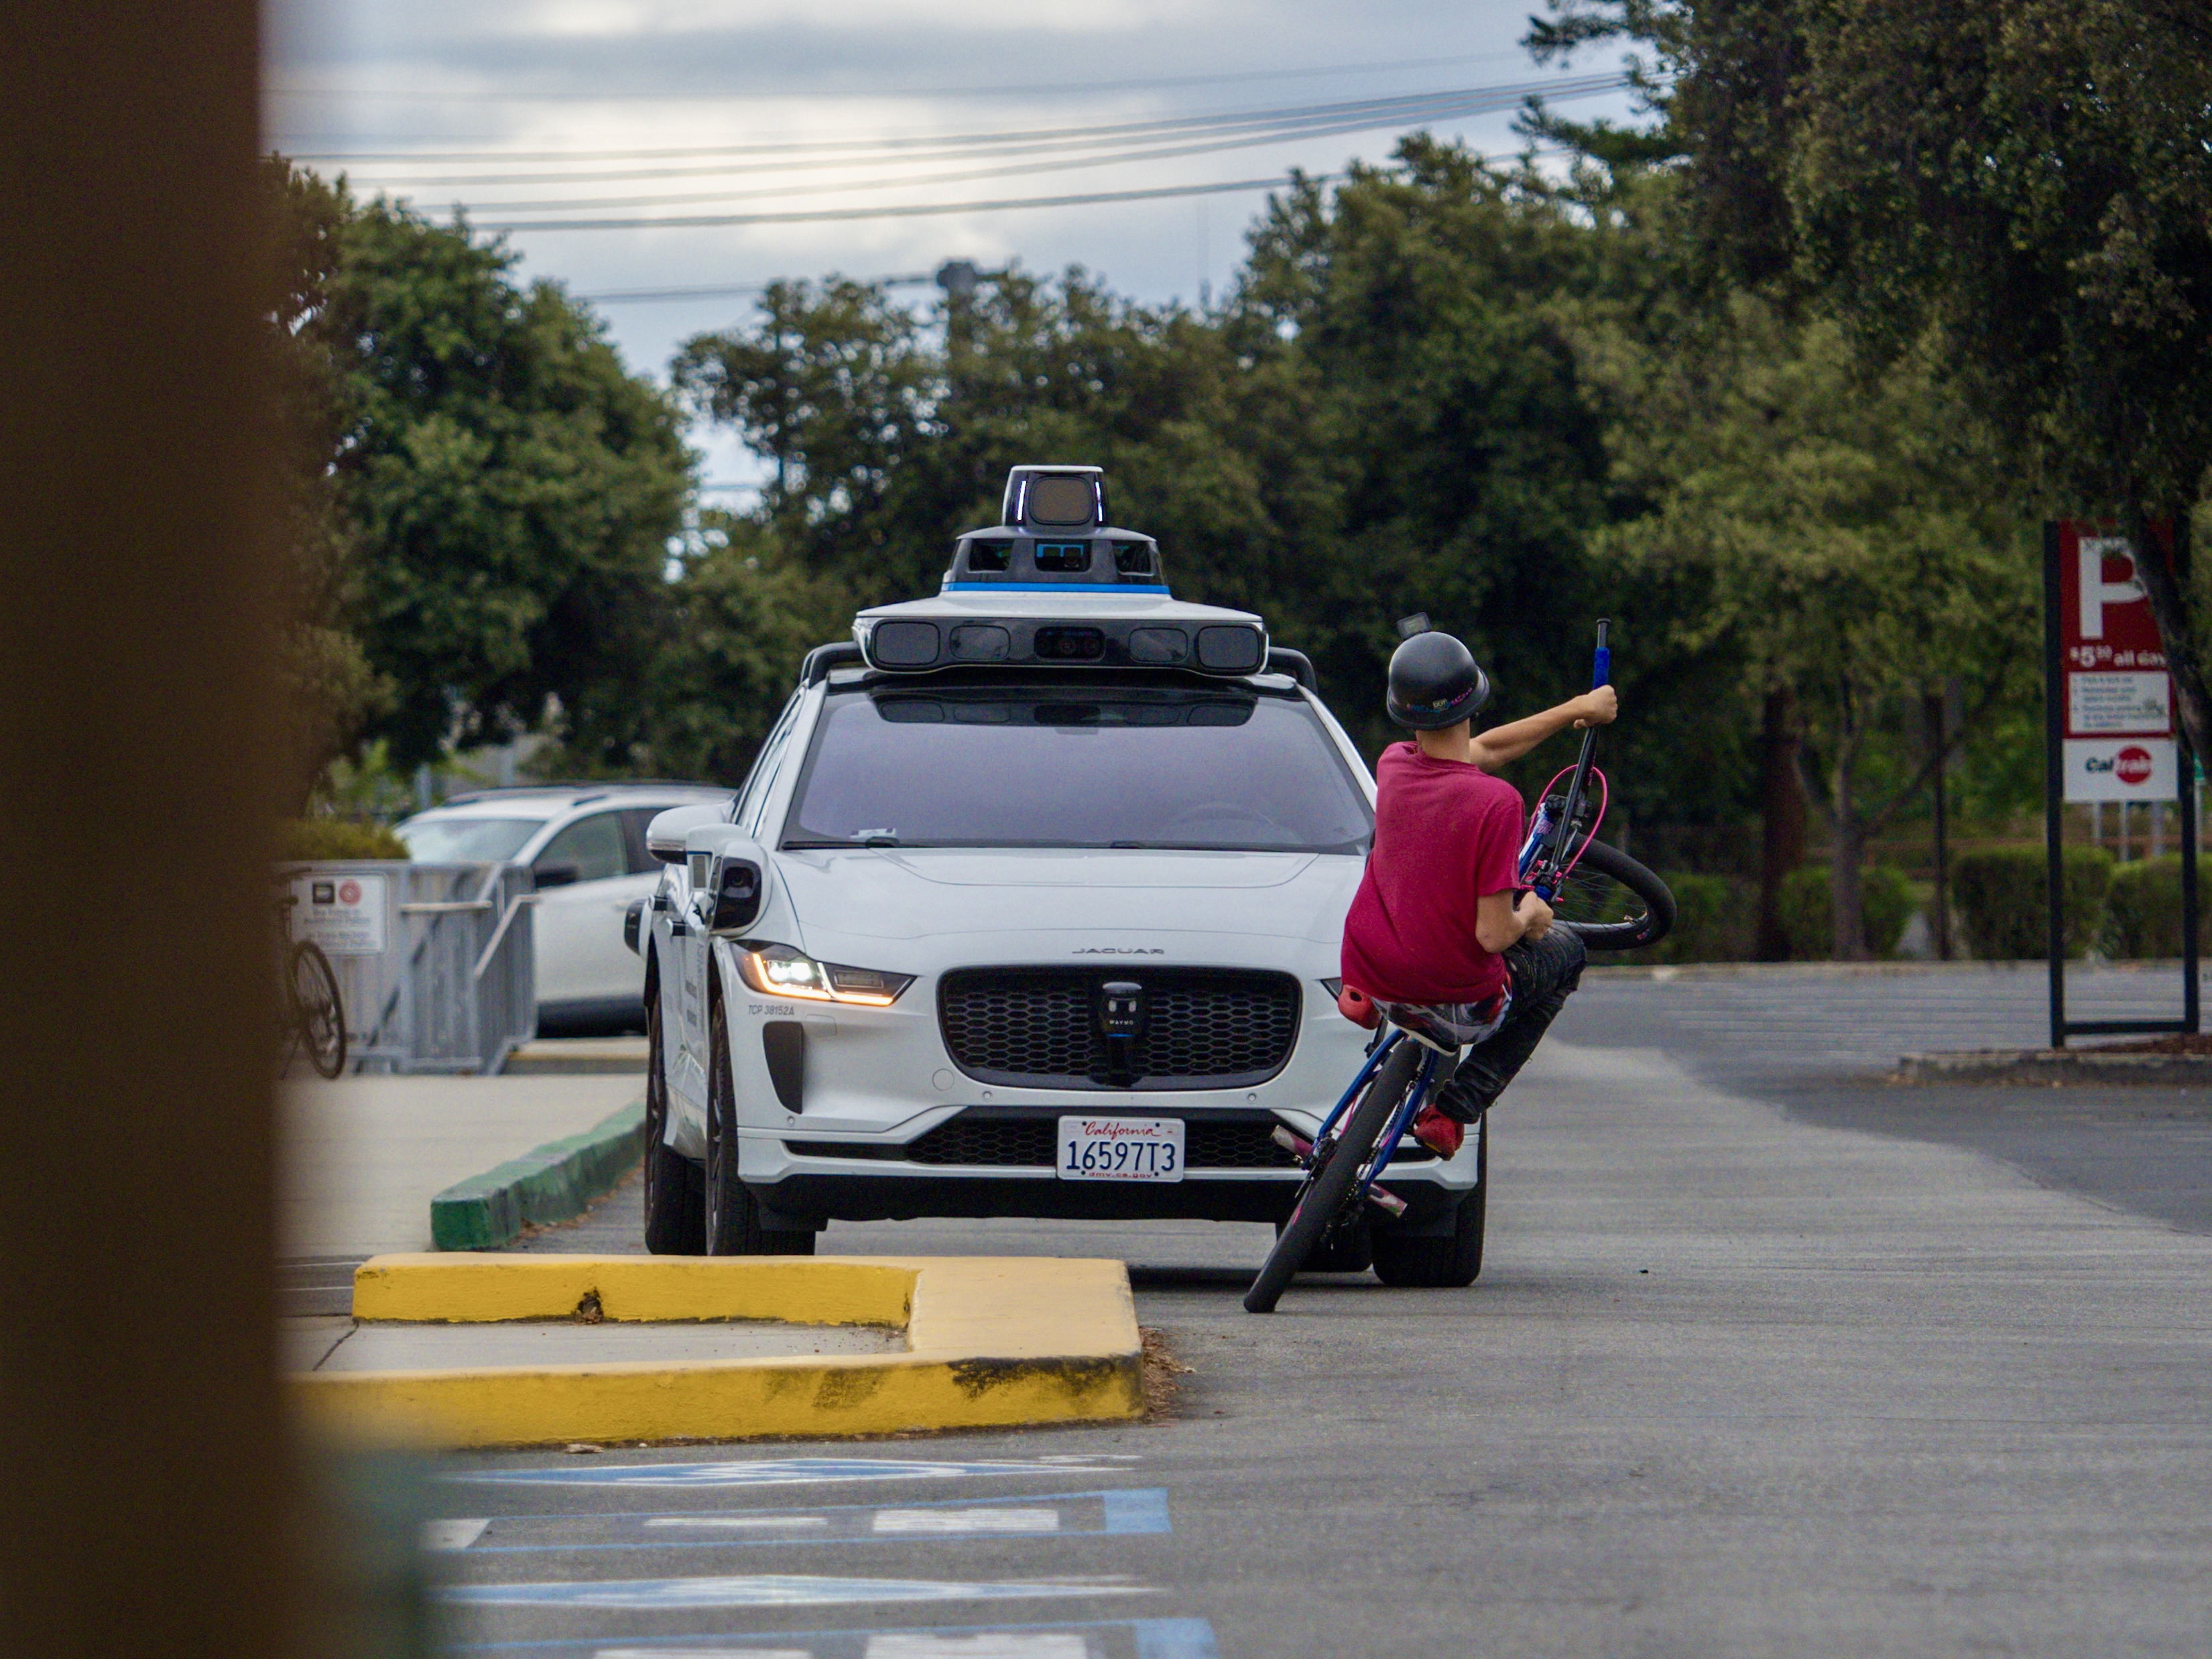
A child on a bicycle passes a Waymo robotaxi in the San Francisco Bay Area. Photo: Anders Eidesvik
The Team
Anders Eidesvik
Norwegian journalist from Bergen. BA in Politics, Philosophy & Economics from the University of Exeter, followed by four years reporting for Klassekampen, Dagens Næringsliv, and NRK. Served at Norway's UN delegation in New York during the country's Security Council tenure. At Stanford, he focuses on data and investigative journalism to explore how AI is reshaping society.
Kate Li
Coterminal student at Stanford with a BA (Honors) in Economics and English and an MS in Management Science & Engineering. Research assistant at Big Local News. Previously interned at D.E. Shaw, Cornerstone Research, and the World Bank. Award-winning writer and poet.
Why This Matters
Whenever a Waymo vehicle is involved in a crash that meets federal thresholds — any injury, airbag deployment or pedestrian or cyclist involved, and most crashes with more than minor damage — the company must report it to the National Highway Traffic Safety Administration. That data is public, but it is buried in government spreadsheets that are difficult to parse and full of technical jargon.
We built this website because we believe the public deserves to see this data clearly. Autonomous vehicles are being tested on the streets where people live, work, and walk their kids to school. People in these cities share their streets with this technology whether or not they ever ride in it.
Our goal is not to argue that self-driving cars are safe or unsafe. It is to show you the evidence and let you draw your own conclusions.
Design Principles
- Transparency first. Every number on this site can be traced back to a specific public data source. Our full methodology is documented. Our code is open-source.
- Plain language. We translate technical crash classifications into everyday English. If your neighbor would not understand a label, we rewrite it.
- Let the data speak. We avoid editorializing. We present the numbers, the context, and the primary sources. You decide what they mean.
- Evergreen. This site updates itself. When new crash reports are published, our pipeline pulls the latest data and regenerates every chart and statistic automatically.
Data Sources
This project draws on two primary public data sources:
- NHTSA Standing General Order reports — Federal regulators require Waymo and other developers of automated driving systems to report crashes involving their vehicles, from fatal collisions down to many minor ones (the exact thresholds are on our methodology page). This dataset includes incident narratives, severity assessments, and location information.
- Waymo Safety Impact Data Hub — Waymo publishes its own curated dataset that adds crash type classifications and links each incident to the corresponding federal report.
- Waymo mileage milestones — A dataset of Waymo's cumulative rider-only miles over time, compiled by Anders Eidesvik from press releases, public statements, and archived web data.
We merge these sources in an automated pipeline that runs every week. The full technical details are on our methodology page.
Contact
This data journalism project began in Stanford's COMM 277T: Building News Apps. For questions about the data, methodology, or to report an issue, contact Anders Eidesvik (eidesvik@stanford.edu) or Kate Li (kateli@stanford.edu).